Container xChange: Performance Metrics & Risk Profiles
/ Product Design / B2B Marketplace / Data Visualization
01 Context & Challenge
Company Context
Container xChange is the world’s first online B2B marketplace for sharing and trading excess shipping containers. A Series B startup with a global customer base ranging from small traders to large container liners. The platform serves multiple product areas: Marketplaces (leasing and trading), Insurance, Wallet, Ocean Freight, and Insights. The Platform team, where I worked, owned shared infrastructure including company profiles, whose stated goal was: “Create trustworthy relationships between parties on xChange to enable secure transactions.”
The Problem
The marketplace had a fundamental trust and risk transparency problem. In the previous quarter, research revealed that 30–40% of top suppliers had already witnessed default or dispute recovery cases. A CSAT survey of 25 suppliers painted a clear picture of the gap:
| Question | CSAT Score |
|---|---|
| Does xChange provide clear information regarding transaction risks? | 32% |
| How well does xChange help you manage risk across partners and regions? | 40% |
| Satisfaction with risk management tools on the platform | 48% |
| General feeling of security when leasing on xChange | 60% |
Suppliers needed to assess whether a potential partner was reliable before accepting a deal, but the platform offered almost no objective signals to support that decision. The only existing mechanism was a star rating based on self-submitted references, which was too general and not perceived as trustworthy enough for transactions involving real financial risk and physical container logistics.
The consequences were visible. Some companies took their marketplace behavior too casually: late payments, slow container releases, high cancellation rates, damaged or unreturned containers. This had a direct negative impact on the other party in each deal. Over time, it led to deal fatigue among reliable suppliers who repeatedly ran into problems with unvetted partners.
There was also a dangerous perception gap. Many suppliers believed they could do risk-free business on xChange, which did not reflect reality. When things went wrong, xChange was blamed. The company needed to shift from being the “responsible partner” to becoming a neutral platform that provides suppliers with the information they need to manage risk themselves.
The hypothesis was clear: if we offered suppliers an easy-to-understand overview of a partner’s operational and financial reliability, they would be able to better assess risk on their own. Better decisions would lead to fewer conflicts, and the transparency would ultimately bring more transactions to xChange as suppliers sought this visibility for their broader business.
Challenges
- No objective, data-driven trust signals beyond generic star ratings
- Self-submitted references created a credibility gap (32% CSAT on risk clarity)
- 30–40% of top suppliers had experienced default or dispute cases
- Dangerous perception that xChange fully protects all transactions
- Multiple performance dimensions (financial, operational, responsiveness) needed to be distilled into an understandable system
- Risk of damaging the marketplace by showing too many companies as poorly rated
- Different marketplaces (leasing vs. trading) had different risk profiles and relevant metrics
- Users (the companies being rated) might resist having their metrics shown to suppliers
Goals
- Give suppliers objective, data-driven signals to assess partner risk before accepting deals
- Flag poor performance transparently to incentivize behavioral improvement
- Shift xChange’s positioning from “responsible partner” to neutral risk transparency platform
- Increase deal confidence and ultimately transaction volume
- Create a system that scales across marketplace types with different relevant metrics
- Lay the foundation for future risk-based transaction models and protection packages
Success Metrics
Success was defined on multiple levels. The primary metric was a significant positive development in CSAT scores, particularly Question 2: “Does xChange provide clear information regarding the risks involved in your transactions?” (baseline: 32%). Beyond the survey, we measured behavioral change: companies with poor ratings should become aware and take action. Deal quality should improve as suppliers made more informed partner choices. And the system should contribute to the broader goal of increasing marketplace transactions.
02 Discovery & Research
Research Methods
The initiative was driven by research conducted in the previous quarter. The account management team had been hearing directly from suppliers that they felt let down when risky or problematic partners caused issues. The CSAT survey of 25 suppliers quantified the problem: only 32% were satisfied with risk information clarity, and only 40% felt xChange helped them manage risk.
I collaborated with the account management and risk teams from the start. Rather than conducting additional external user research, we relied on their deep domain expertise. The account managers worked directly with customers daily and understood which behaviors were most predictive of problematic partnerships. The risk team brought knowledge of financial and operational risk factors, including the risk score calculation model.
We ran multiple internal iteration rounds. The account management team formulated the initial briefing, and I worked with them to translate their domain knowledge into measurable, designable metrics. This was a back-and-forth process: they would describe a category of risk, I would identify which data points we actually had in our database, and together we would define calculations that were both meaningful and technically feasible.
Key Findings
Finding 1: Star ratings were not solving the trust problem. The existing reference system allowed companies to submit their own reviews, which made the ratings feel unreliable. The 32% CSAT score on risk clarity confirmed that suppliers did not trust the information available to them. Users needed objective, platform-calculated metrics based on actual transaction behavior.
Finding 2: Performance is multi-dimensional. A company could be financially reliable but operationally slow, or responsive in negotiations but careless with container returns. A single score would not capture these distinctions. The system needed to break performance into meaningful categories that mapped to real decision factors: payment behavior, operational follow-through, container handling, and communication responsiveness.
Finding 3: Data availability varied significantly. Not every company had enough transaction history for every metric. We established concrete thresholds: risk ratings would show after 3 or more completed deals in the last 6 months, performance metrics after 5 completed deals. New or inactive companies would have gaps that the system needed to handle gracefully.
Finding 4: Threshold calibration was critical. We ran test calculations across the entire database to see how companies would distribute across rating tiers. If too many companies landed in “bad” categories, the system would damage marketplace activity rather than improve it. For suppliers who also use the platform, most fell under moderate, low, or very low risk. Edge cases where a supplier appeared as high or very high risk would be treated separately and potentially manually augmented.
Finding 5: User resistance was a real risk. Companies being rated might not want their metrics shown to suppliers. The mitigation strategy was twofold: communicate before launch to give high and moderate risk companies a chance to improve, and create incentives for data sharing (e.g. higher credit limits for companies that provide documentation).
Competitive / Analogous Analysis
I explored how other platforms handled trust and reputation systems. Trustpilot’s model was closest to the star rating we already had, sharing the same limitation: too general for specific B2B decisions. Kleinanzeigen (Germany’s largest classifieds platform) had a multi-category rating system that was a better reference point. However, none of the existing models were well suited for a B2B shipping container marketplace. We used these as orientation but designed a system specific to the behaviors and risks that matter in container logistics.
03 Design Process
Strategic Direction
The strategy operated on two levels. On the product level: surface objective transaction data in a way that was immediately scannable and required no interpretation. On the business level: shift xChange’s role from being the direct “responsible partner” (blamed when things go wrong) to becoming a neutral platform providing risk transparency. The brief explicitly stated: “By offering this risk transparency service, we move away from the current unfavorable role of being the direct responsible partner towards becoming the neutral platform that provides suppliers with all the information that they need.”
The system needed to work in two contexts: company profiles (detailed view with all metrics and explanations) and marketplace search cards (summary view with quick trust signals). The deeper principle was that transparency drives behavior. If companies can see how they are being evaluated, and if their potential partners can see those evaluations, the marketplace self-corrects toward better behavior.
Exploration & Ideation
I explored several visualization approaches before arriving at the final system. Early concepts included numerical scores from 1 to 5 with scoring bars, but these always relied on interpretation from the user. What does a 3.2 in “Release speed” actually mean? Is that good or bad? The problem with abstract scoring is that it shifts the cognitive load to the user.
I also explored different color treatments for negative ratings. In early iterations, poor performance was less visually differentiated. We deliberately chose a graduated system where bad ratings were visible but not alarmist, keeping the system informative rather than punitive. The goal was to flag risk, not to shame companies.
Design Decisions
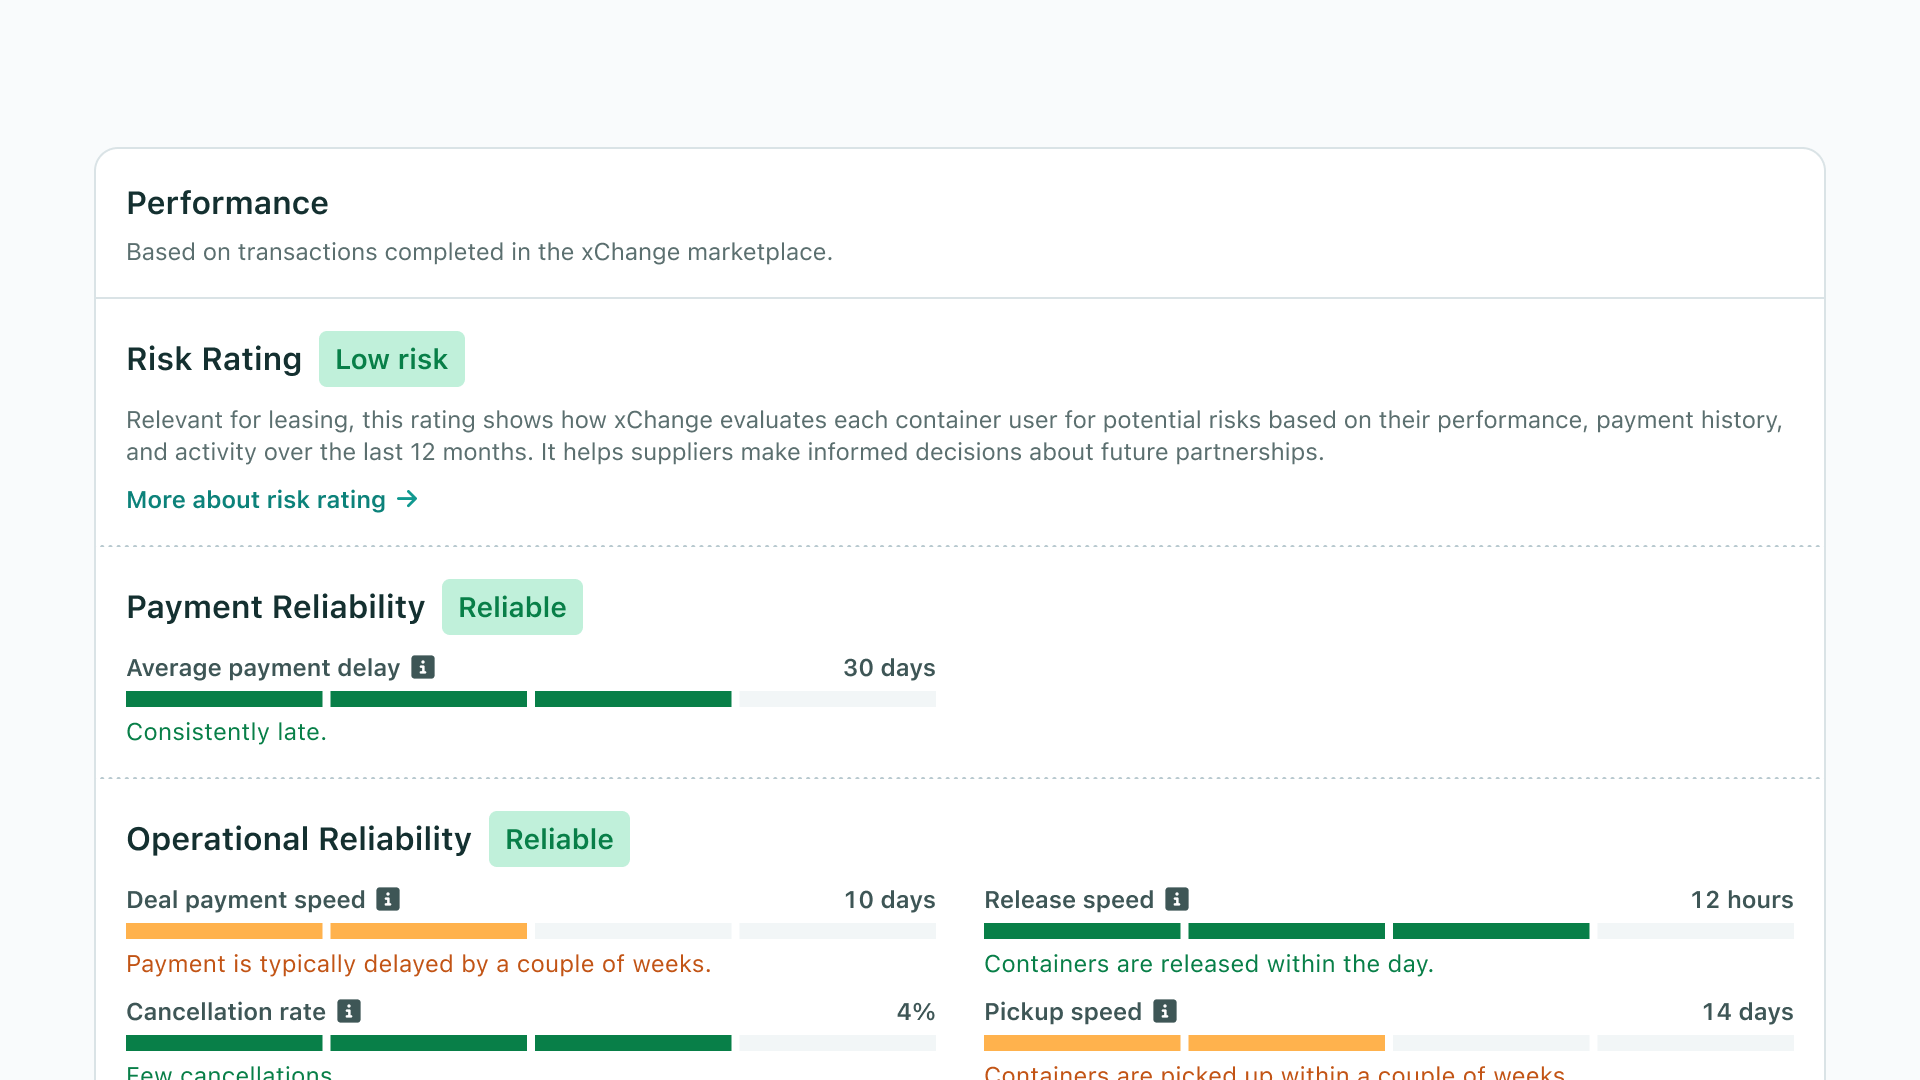
Decision 1: Traffic light system over numerical scores. I chose a segmented bar visualization with four color tiers (green, light green, orange, red) plus a grey “not available” state. Each metric displays a value (e.g. “3 hours,” “1%,” “4 days”), the colored bar showing where that value falls, and a human-readable label explaining the rating (e.g. “Containers are picked up immediately,” “Frequent cancellations”). This approach eliminated the need for users to interpret raw numbers. The color provides instant signal, the value provides specificity, and the label provides context.
Decision 2: Grouped metric categories aligned to decision factors. Rather than showing a flat list of metrics, I organized them into five categories that map to how suppliers actually evaluate partners: Risk Rating (overall score from 0–100, leveled from “Very High Risk” to “Very Low Risk”), Payment Reliability (overdue invoice settlement), Operational Reliability (deal payment speed, cancellation rate, release speed, pickup speed), Drop-off Performance (historical loss rate, damage rate, overuse rate, average container usage time), and Responsiveness (reply speed, response rate). This grouping was developed in collaboration with the account management and risk teams.
Decision 3: Explicit handling of unavailable data. When a metric cannot be calculated (fewer than 5 completed deals in the last 6 months), the system shows “Not available” with an “Insufficient data” explanation rather than hiding the metric. This was a deliberate UX decision: profiles should maintain a consistent structure so customers encounter a predictable layout. They should not have to search for metrics that shift positions across profiles. Additionally, a new customer would otherwise see a completely blank profile with no indication of what information could eventually appear. The consistent structure communicates the potential value of the profile even before data is available.
Decision 4: Separate badge treatment for leasing vs. trading search cards. Leasing and trading involve fundamentally different risk levels. Since trading carries little to no risk, displaying risk badges on trading cards would be irrelevant and potentially confusing. I kept risk indicators only on leasing search cards, where suppliers need to assess partner risk before accepting deals. The leasing cards show badges for Responsiveness, Financial Reliability, Operational Reliability, and Risk Score.
System & Pattern Thinking
I designed the performance widget as a modular component within the company profile system. Each metric follows the same visual pattern: label, info tooltip, segmented bar, value, and description. This consistency means users learn the pattern once and can scan any metric immediately. The component scales to different marketplace types and company profiles: pure suppliers see N/A for user-specific metrics, companies with both supplier and user activity see the full range, and new/inactive companies see the consistent structure with “Not available” states. The architecture supports adding new metrics without redesigning the interface. Average container usage time, for example, is displayed as a plain number without color levels because it does not carry a “good” or “bad” value, just a factual indication.
04 Solution
Overview
I shipped a comprehensive performance metrics and risk profile system integrated into company profiles and marketplace search cards across Container xChange. The system included 11 individual metrics organized into 5 categories, a tiered visual rating system, tooltip-based explanations, summary badges on leasing search listings, and a pre-launch communication strategy for affected users. The metrics are calculated from actual transaction data over the last 6 months, providing objective trust signals that complement the existing star rating and references.
Performance Widget on Company Profiles
The full performance section lives on the company profile page, showing all applicable metrics grouped by category. Each metric displays its calculation result, a color-coded segmented bar, and a plain-language description. Information tooltips provide deeper definitions for users who want to understand what a specific metric measures and how it is calculated. Categories include Risk Rating (overall, based on financial and corporate factors), Payment Reliability (overdue invoice settlement), Operational Reliability (deal payment speed, cancellation rate, release speed, pickup speed), Drop-off Performance (historical loss rate, damage rate, overuse rate, average container usage time), and Responsiveness (reply speed, response rate).
Summary Ratings on Leasing Marketplace Search Cards
Key performance indicators are surfaced directly on container listing cards in the leasing marketplace search results. Users can see badges like “Very Responsive,” “Very Reliable,” or “Very low Risk” next to a company’s name before clicking through to the full profile. This integration was critical: suppliers browse dozens of listings, and surfacing trust signals at the search level reduces friction and supports faster, more confident decisions. Trading search cards intentionally exclude risk badges since trading involves minimal risk.
Transparent Data States
The system handles five distinct states per metric: four performance tiers (from excellent to poor) plus “Not available” for insufficient data. The grey state with its “Insufficient data” label was a deliberate design choice to maintain honest, consistent profiles. Risk ratings require 3 or more completed deals in the last 6 months. Performance metrics require 5 or more. Below these thresholds, the metric structure remains visible but shows N/A values with explanatory text.
Verified Documents Section
As part of the broader company profile redesign, I designed a verified documents widget showing which compliance documents a company has provided: company registration, CEO identification, audited financials, bank statements, and professional liability insurance. This section encourages document sharing (which improves risk assessment accuracy) while giving suppliers additional confidence signals.
Interaction Details
Each metric includes an info tooltip icon that reveals the metric definition, what it measures, and why it matters. This layered information architecture keeps the default view clean and scannable while making the full context available on demand. The tooltip content was written in collaboration with the account management team to ensure accuracy and relevance.
The segmented bar visualization communicates both position and range. Users can see not just their potential partner’s current rating but where it falls on the overall scale. This contextual positioning helps suppliers calibrate their expectations, especially for metrics where thresholds might not be intuitive (e.g. what constitutes a “fast” release speed in the container industry).
Cross-platform Considerations
The performance metrics needed to work across different marketplace contexts and company types within the same platform. Pure suppliers see N/A for user-specific metrics. Suppliers who also use the platform see the full range including risk rating. New or inactive companies see the consistent profile structure with “Not available” states. The company profile is a unified experience: it does not focus on specific user roles between marketplaces but represents an overall view of a company’s performance and reliability.
05 Implementation & Iteration
MVP & Phasing Strategy
We prioritized getting the system live with all metric categories for the leasing marketplace. The collaboration with account management and risk was ongoing throughout implementation: as we tested calculations against the full database, we calibrated thresholds to ensure the distribution of ratings was fair and would not destabilize the marketplace.
Goals of the MVP:
- Validate metric calculations against real data: Run the defined calculations across the entire company database to verify that rating distributions were reasonable. Most suppliers who also use the platform fell under moderate, low, or very low risk. Edge cases were flagged for manual review.
- Ship the complete profile integration: Launch the full performance widget on company profiles with all 11 metrics, five categories, and the verified documents section.
- Surface summary badges on leasing search cards: Bring the most impactful trust signals into the search flow where suppliers make initial partner assessments.
Pre-Launch Communication
Before launch, we executed a targeted communication strategy. Users with very high, high, and moderate risk ratings were notified that their ratings would become visible. This gave them a window to improve their behavior or provide additional documentation before the information went live. This was both a fairness measure and a strategic decision: it meant the system started driving behavioral improvement before it was even publicly visible.
Collaboration & Handoff
This was a cross-functional effort. The account management and risk teams drove the initiative and defined which behaviors mattered. I owned the design: translating domain requirements into a visual system, defining the metric architecture, designing the component patterns, specifying the interaction model, and creating the company profile documentation. Engineering implemented the data calculations and frontend components based on the design specifications.
Post-Launch Iteration
After launch, we observed immediate behavioral signals. Several companies with poor ratings contacted account management to understand why their ratings were low and what they could do to improve. This was exactly the intended outcome: making performance visible created a feedback loop that incentivized better behavior without requiring enforcement actions.
The reviews section was moved to a dedicated tab to prioritize performance metrics in the main profile view. This gave the metrics clearer visibility while keeping reviews accessible.
One limitation we identified but did not ship was a grace period mechanism for new marketplace participants. Companies that had just joined xChange had “Not available” across most metrics, which was accurate but potentially disadvantageous in competitive search results where established companies displayed full rating badges.
06 Outcomes & Impact
| Metric | Result |
|---|---|
| Marketplace transactions | Contributed to a 40% increase over 6 months (est. ~10% attributable to improved supplier behavior through risk transparency) |
| Performance dimensions | 11 individual metrics across 5 categories |
| Trust signal coverage | From 1 generic signal (star rating) to multi-dimensional, data-driven assessment |
| Risk clarity (CSAT baseline) | 32% satisfaction before launch |
| Marketplace integration | Performance badges surfaced on leasing search cards |
| Behavioral response | Companies with poor ratings proactively sought improvement before and after launch |
The 40% increase in marketplace transactions over 6 months was a company-wide result driven by improvements in inventory quality, supplier behavior, and matchmaking. The performance metrics system was a significant contributor to the supplier behavior improvement, which we estimate accounted for approximately 10% of the overall transaction increase. The system changed how deals were assessed and accepted on the platform.
The most telling outcome was the reaction from companies with poor ratings. Several reached out to account management asking why their ratings were displayed and how they could improve. Some were initially frustrated, which confirmed that the system was working: it was making previously invisible performance visible. The fact that these companies then took action to improve their behavior validated the core hypothesis that transparency drives self-correction.
For suppliers, the performance badges on search cards changed the decision-making dynamic. Previously, suppliers tended to stick with familiar companies because there was no way to evaluate new partners objectively. With performance metrics visible at the search level, suppliers became more willing to close deals with companies they had not worked with before, provided their ratings were strong.
The pre-launch communication was particularly effective. Notifying high and moderate risk companies before the metrics went public gave them agency to improve, which meant the system was already driving positive behavior before it was fully visible to all users.
Organizational Impact
This project was foundational for xChange’s strategic direction. It established the first objective, data-driven trust layer on the marketplace. More importantly, it marked the beginning of xChange’s shift from being perceived as the “responsible partner” (liable when things go wrong) to being a neutral platform providing risk transparency. This was not just a product change but a business positioning change.
The risk profile system was explicitly designed as the foundation for future transaction models. The metric framework also created a shared language between platform, account management, and risk teams for discussing company performance.
07 Learnings
The biggest insight from this project was that surfacing data changes behavior more effectively than rules or enforcement. We did not tell companies to pay faster or return containers on time. We showed them, and their potential partners, how they were actually performing. That visibility alone was enough to trigger improvement. The pre-launch notification strategy amplified this: giving companies advance warning created a wave of behavioral improvement before the system even went live.
Relying on internal domain expertise rather than external user research was a pragmatic and effective choice. The account management and risk teams had direct, daily contact with suppliers who were frustrated with partner quality. The CSAT data quantified what they already knew from conversations. That said, the grace period for new joiners is a clear example of something we learned only after launch. New companies with mostly “N/A” metrics were at a disadvantage in search results compared to established companies with full badge sets. If I approached this again, I would build the grace period into the MVP rather than treating it as a follow-up.
The collaborative metric definition process worked well. The back-and-forth between what behaviors matter (account management expertise) and what data we can actually calculate (my awareness of the system’s data model) produced metrics that were both meaningful and technically sound. Running test distributions across the full database before launch was essential: it prevented us from shipping a system that would have unfairly penalized too many companies and damaged marketplace activity.